
Description:
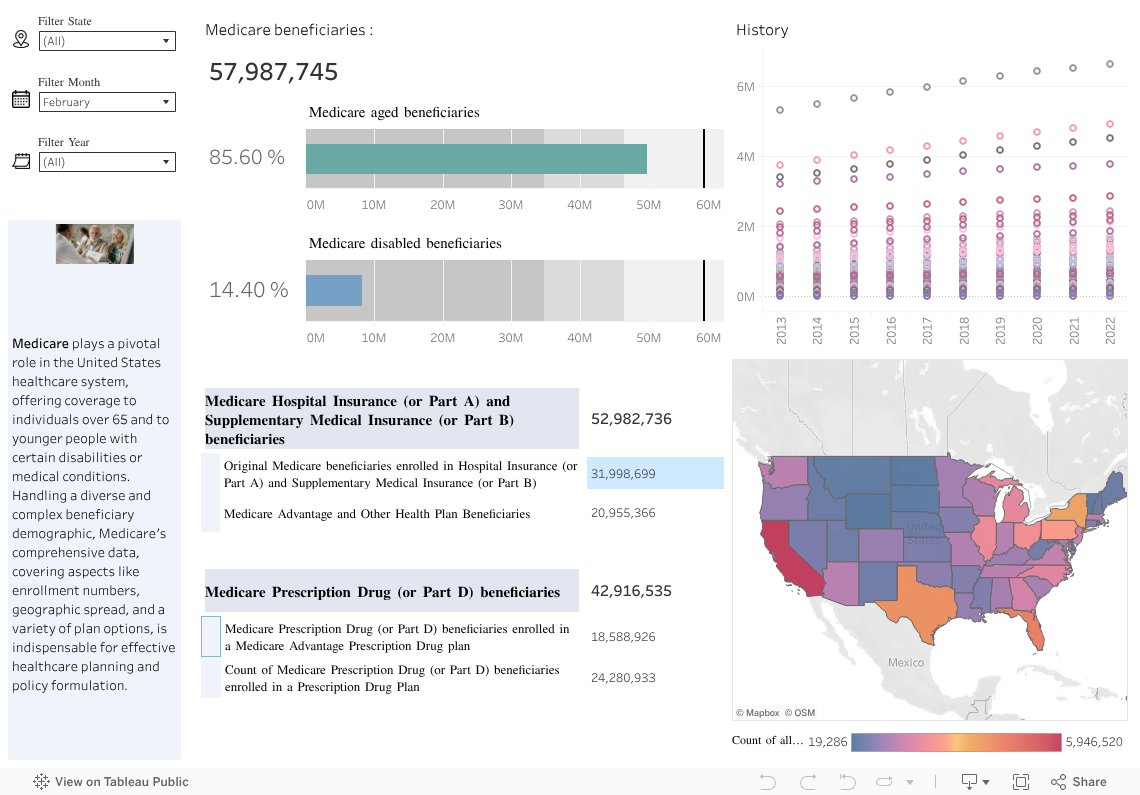
This interactive Tableau dashboard delivers an insightful exploration into the dynamics of Medicare enrollment, spanning hospital/medical coverage and prescription drug plans across the United States. It meticulously differentiates between Original Medicare and Medicare Advantage plans, accompanied by demographic details. A key feature of the dashboard is its interactivity; viewers have the capability to tailor the data display through filters for year, month, and state, enabling a customized view that meets their specific analytical needs. This level of granularity not only highlights national trends but also dives deep into state and county-level data, offering a comprehensive snapshot of Medicare’s footprint.
Impact:
This consolidated approach to visualizing and analyzing Medicare data facilitates a deeper understanding and more informed decisions across various sectors involved in healthcare planning, provision, and utilization.